Getting Started
To start using Cyscale, start your Free Trial, or please contact us at [email protected].
Connecting Cloud Accounts, Clusters, Identity Providers, and Code Providers
For specific details on how to integrate with each of the supported providers, follow the links below:
- AWS Integration (cloud)
- Azure Integration (cloud)
- Google Cloud Integration (cloud)
- Alibaba Integration (cloud)
- Kubernetes Integration (cluster)
- Okta (IdP)
- Entra ID (IdP)
- Code Scanner Capabilities (GitHub, GitLab.com, and self-hosted GitLab)
The connector wizard is designed to cover both straightforward and larger-scale onboarding scenarios:
- AWS can onboard a single account or an AWS Organization.
- Azure can onboard a single subscription or all subscriptions available under a tenant.
- Google Cloud can onboard a single project or use organization support to discover matching projects.
- Kubernetes onboarding generates a connector-specific API key and Helm command, with optional SBOM collection for vulnerability scanning.
- Code scanning starts from the repository provider you already use: GitHub, GitLab.com, or a self-hosted GitLab instance.
- Virtual machine scanning can use disk snapshots or SSH access, so teams can choose the collection model that fits their environment.
During onboarding, Cyscale can also preconfigure connector-level notification types and, for supported cloud providers, sync exclusions for specific asset types or tagged resources.
Sync and Assessment
Once you've connected your cloud environment (or identity provider), Cyscale starts exploring your infrastructure through the provider's APIs. Once Cyscale created a snapshot of your cloud assets, it will perform the assessment. This translates into Cyscale going over the list of controls and looking for assets that fail to meet the requirements.
By default, Cyscale synchronizes your cloud assets and performs the assessment every 24 hours. If you added a connector at 1:24 PM, all subsequent automatic scans will be conducted at 1:24 PM.
Once the assessment is complete, Cyscale will generate the corresponding alerts and store the result in the form of failed assets. These are the basis for determining which controls fail (the ones with failed assets), the security score, and policy/standard status.
If you open the connector overview while the first synchronization is still in progress, you should see a loading indicator. Otherwise, you should see high-level posture information for the connector you just added, similar to the following image:
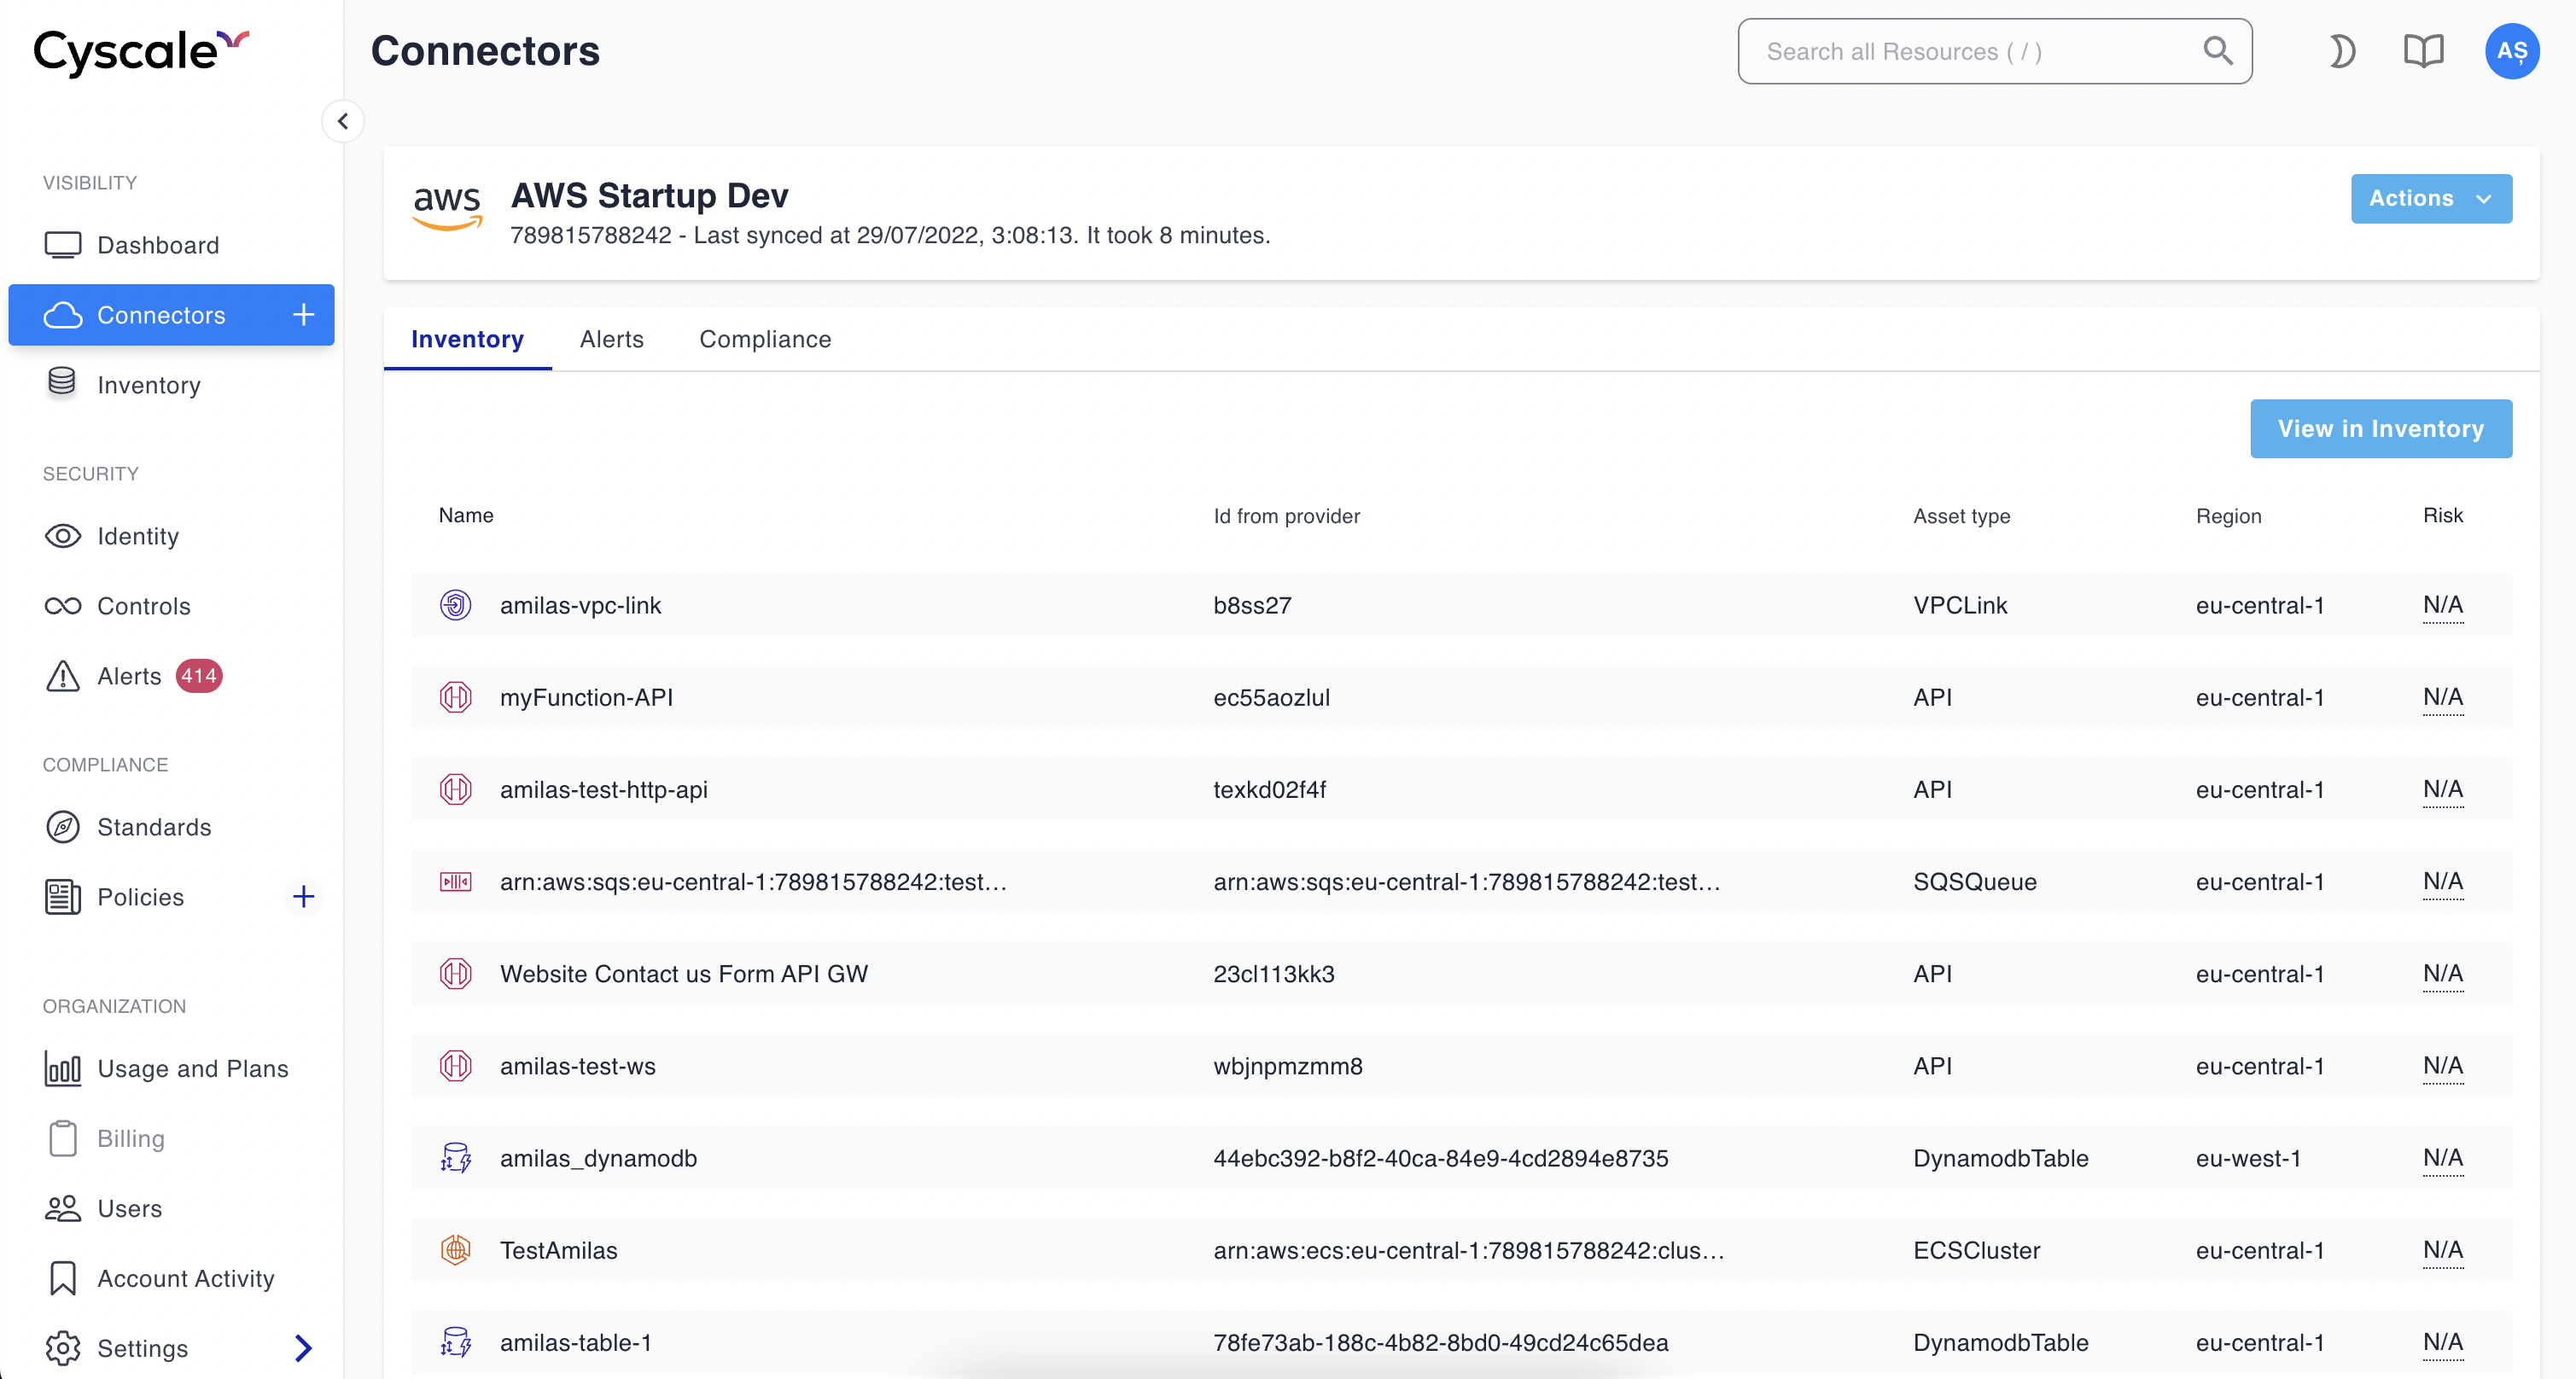
Besides the scheduled syncs, you can manually trigger the process at any moment by pressing the Sync button. This is helpful if, for example, you changed your infrastructure or want to validate that certain vulnerabilities are indeed fixed. You can find out when Cyscale performed the last sync and how long it took by hovering over the Sync button.
What's Next
At this point you can explore the rest of the platform:
- use the Inventory section to browse assets, pivot by asset type, and investigate with Query Builder
- review Alerts, vulnerabilities, code findings, and connector overview cards to prioritize remediation
- open the controls library to inspect built-in or custom controls
- check compliance coverage for standards such as ISO 27001, SOC 2, PCI DSS, CIS, and others
- configure notification channels and issue-management integrations for your operating workflow
Additionally, you can always add more connectors.