Alerts
An alert represents a specific issue of a certain asset. Cyscale creates alerts for assets that are not compliant with the controls it checks.
The Alert Lifecycle
The alerts are part of the assessment process that happens whenever Cyscale syncs your connectors (for both automatic/scheduled and manual triggers).
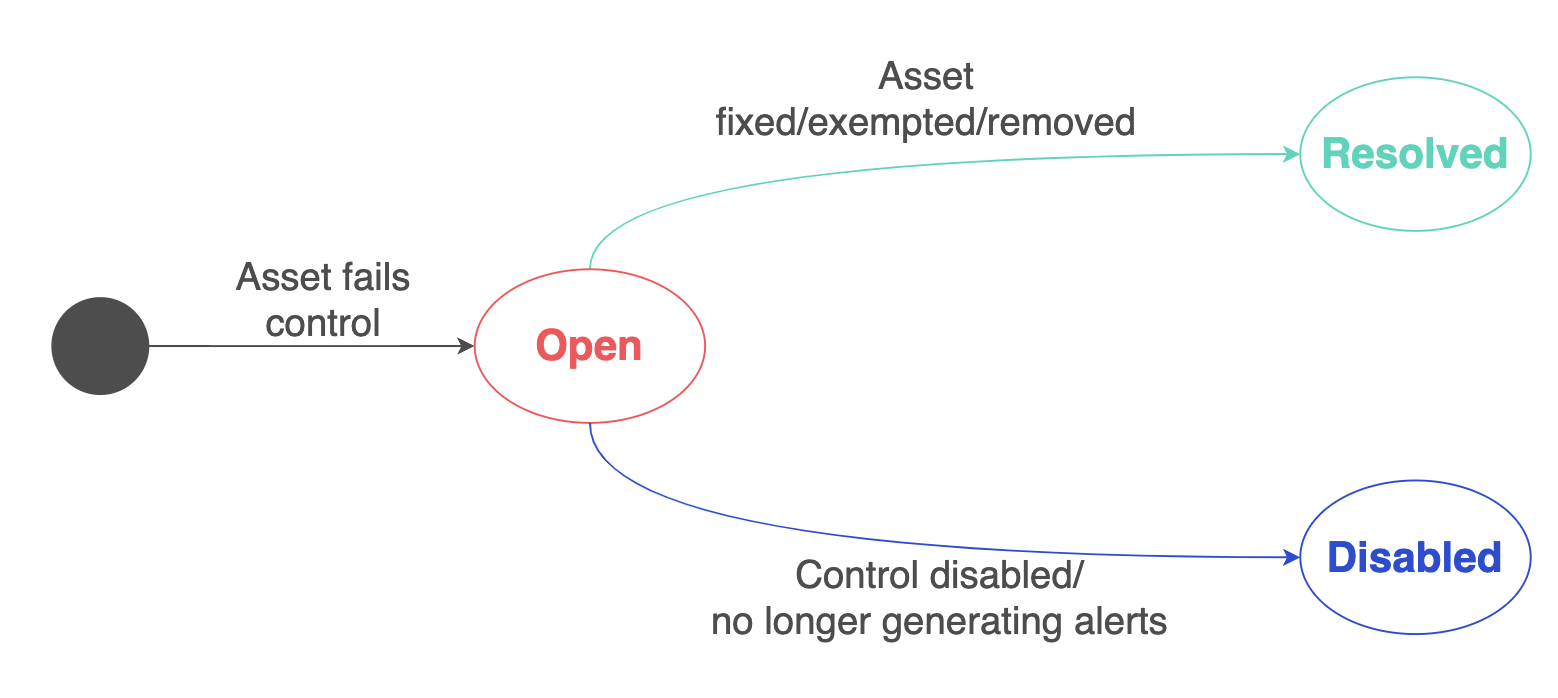
When Cyscale identifies that an asset does not pass a control for the first time, it creates a new alert with the status Open.
Whenever Cyscale generates new alerts, it sends them via email to each user that’s part of the Cyscale account. Each user can change this from the user settings page. Read more on the notifications docs.
The alert will remain Open until the asset either passes the control or is removed (or no longer visible to Cyscale - e.g., you might have changed the AWS regions in Cyscale), in which case the alert is moved to Resolved.
In the case of regression (i.e. the asset fails again after previously being fixed), Cyscale creates a new alert with the status Open.
The other alternative is when you disable the respective control or update it to stop generating alerts. In this case, Cyscale moves all the alerts for the respective control to Disabled right after you update the control.
Managing Alerts
Alert Generation
You can influence which controls Cyscale must generate alerts for by changing the Severity Alerting Level from the Organization Settings page. Cyscale will generate alerts for controls with severity equal to or greater than the configured level.
The default level is medium. Cyscale will not generate alerts for low severity controls out of the box. We made this choice to keep the number of alerts as manageable as possible, especially after you connect your accounts for the first time.
As soon as you change the alert generation, Cyscale will disable any Open alerts that are no longer needed. For example, if you increase the severity alerting level from medium to high, Cyscale will disable all medium alerts. If you lower the level back to medium, Cyscale will start generating alerts for medium severity controls during the subsequent assessments.
The Alerts Page
You can see all the alerts on the alerts page. You can view the alerts in two ways:
- grouped by control (the failing controls, each with the number of alerts)
- all alerts
By default, Cyscale shows you the latest Open alerts (i.e. sorted descending by the Created at date field). Besides the provided sorting criteria, Cyscale shows the alerts that have the most impacted assets first if the alerts have the same value for the sorting criteria. For example, if you sort the alerts page by severity descending, Cyscale will show the alerts with the highest severity that have the most impacted assets first, then the highest severity alerts that have no impacted assets followed by alerts with a lower severity.
Cyscale provides the following actions that you can perform on one or multiple alerts (batch):
- Dismiss - this is how you tell Cyscale that you don’t want to see the selected alert(s). Cyscale will move the alert(s) to the Dismissed tab until the next assessment. If the issue is still there, Cyscale will move the alert back to the main tab.
- Exempt - instruct Cyscale to always consider this asset as passing this control. You will have to provide a reason for exemption.
- Create Jira Issue - create a Jira issue directly from Cyscale with the details of the alert. See Jira Cloud for more.
Impacted assets
The alerts for contextual controls also display the impacted assets for that misconfiguration, that is assets, which become vulnerable due to the issue identified in the primary assets by the control. For example, an alert for a control that checks if the security group allows SSH access from the internet will display the assets (VMs) using the misconfigured security group, since those assets would be vulnerable to an external remote service attack.
Contextual Control Graph for an Impacted Asset
To view a contextual control graph for an alert, click on the "Impacted Assets" column within the alert to access the graph with a list of impacted assets. Alternatively, you can click on the specific alert to open the Alert Details and then navigate to the Graph tab. This will allow you to visualize the relationships and connections associated with the alert.
On the left side, you can see a list of Impacted assets, and on the right side, a graph is displayed. When nothing is selected from the Impacted assets list, you can view a graph that displays the primary asset along with all the impacted assets for a specific control. This graph allows you to examine and trace the path between the primary asset and any impacted asset. Additionally, you can observe all the assets located between the primary and impacted assets.
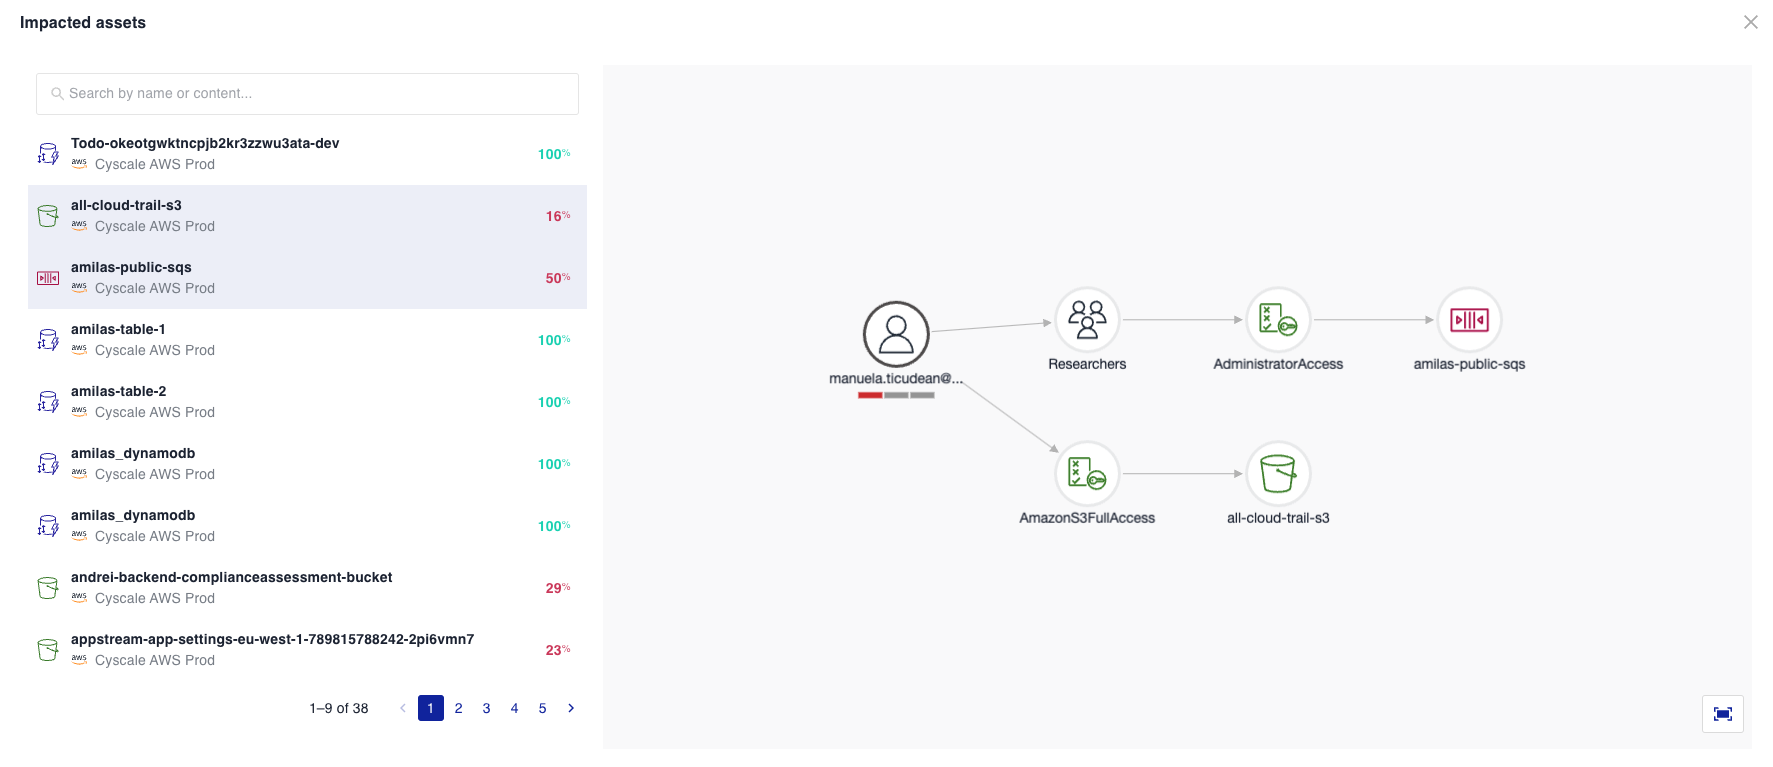
You can select one or more assets from the impacted assets list. When an asset is selected, the graph will show the relationships between the primary asset and the selected secondary asset.
For example, for the 'Ensure Datastores are not accessible by users without MFA' control, you can refer to the following graph:
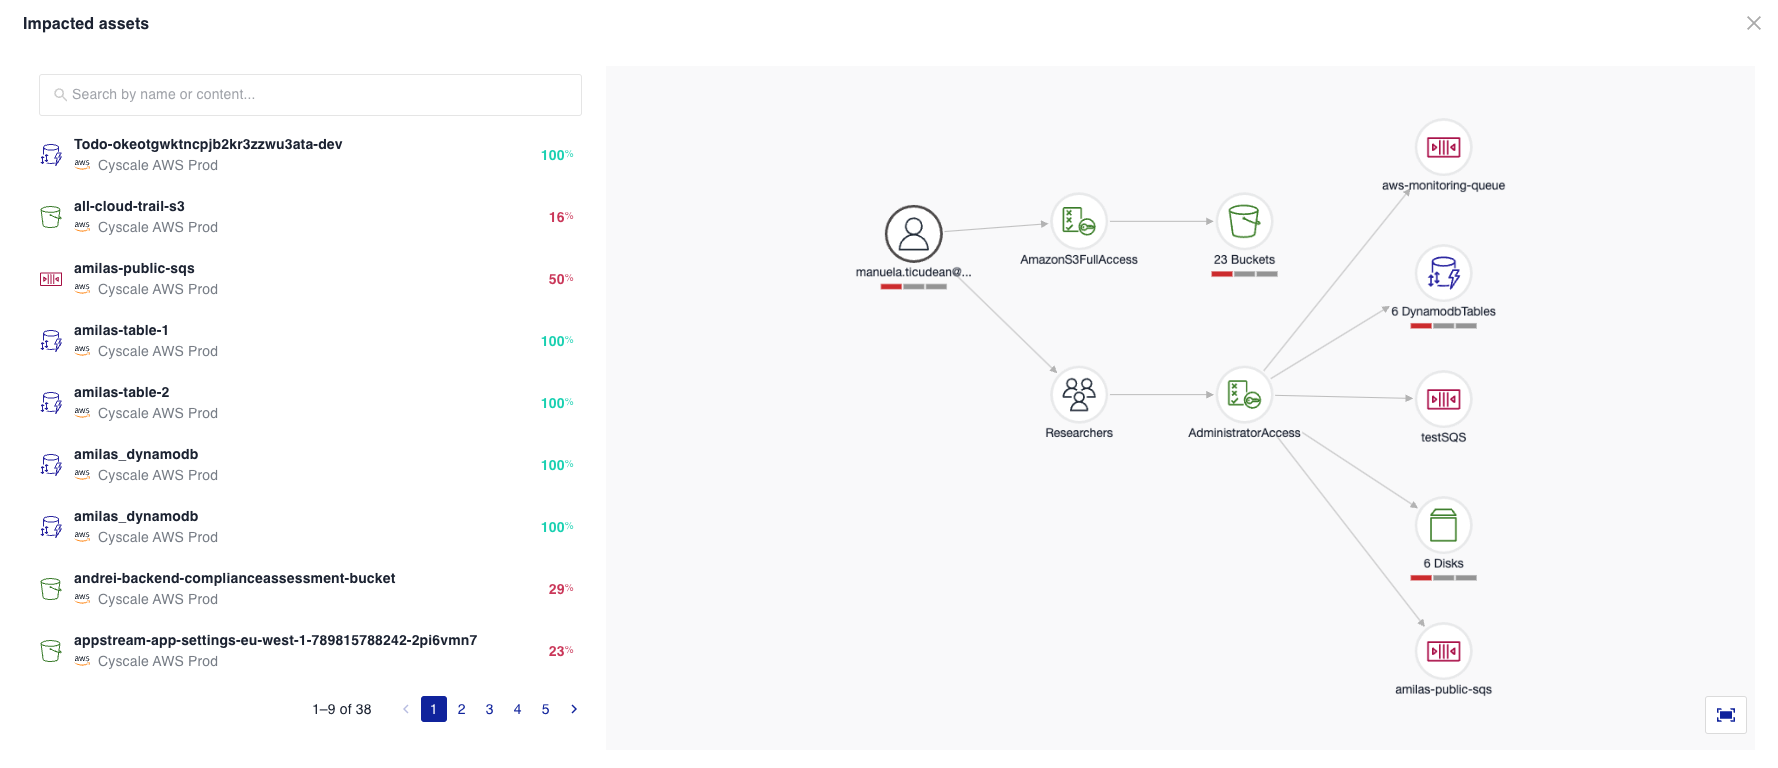
In the example below, an IAMUser without MFA has been granted access to multiple datastores (such as Buckets, DynamoDB Tables, Discs, etc.).
If you want to see the relations related to a specific Bucket and SQSQueue, you can click on the assets from the list, and the graph will filter the nodes to show only the selected impacted assets.